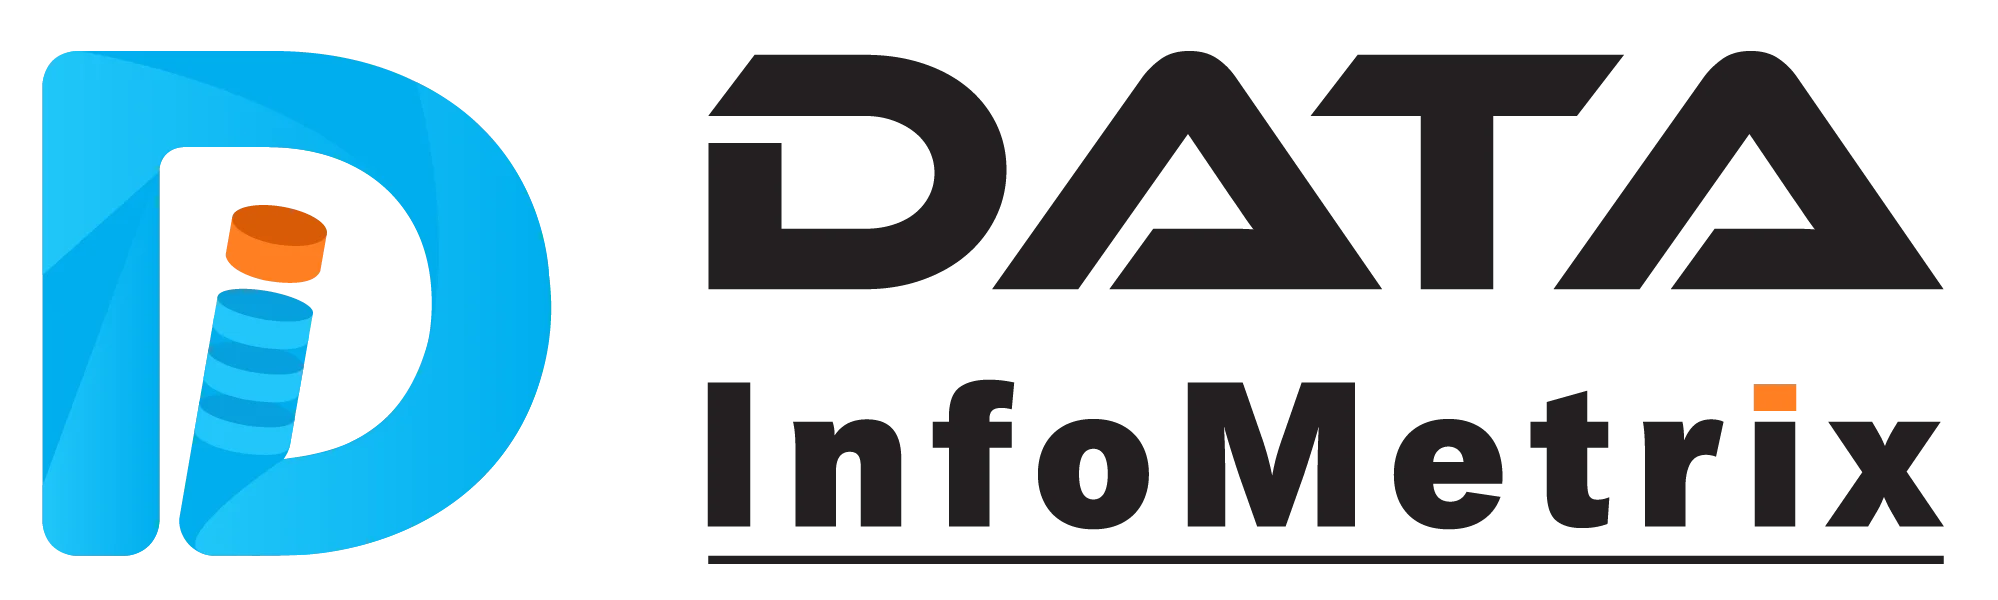








State of the Installed Base 2027: What 997 Technology Lists Say About Where B2B Software Lives
Our first annual report on the B2B installed base, built from 40.3M+ company records across 997 technology lists. Where software is concentrated, how AI compares with CRM and ERP, how AI-era layoffs are shrinking seats, and what it all means for 2027 campaigns.
On this page27 min read
By John Britton, VP of Marketing at Data InfoMetrix
State of the Installed Base 2027 · by the numbers
The short answer: We analyzed every technology list we maintain, 997 of them covering 40,349,909 company records, to map the B2B installed base going into 2027. The installed base is a long tail. A handful of small-business platforms dominate the counts, most valuable audiences are small, AI tools already have an installed base in the same range as CRM, and categories differ sharply in how concentrated they are.
- Only 5 technologies have more than a million companies. 636 of 997 lists (63.8%) have fewer than 25,000.
- The 10 largest lists hold 31.2% of all company records. The 897 smallest still hold 40.1%.
- AI infrastructure accounts for 2,487,324 company records, more than CRM (2,290,691) or ERP (1,758,821).
- In E-Commerce the three largest platforms hold 69.2% of the category. In Marketing & Sales they hold 11.2%.
- AI-era layoffs are cutting seats faster than they cut installed bases. Seat-priced categories such as sales, support, recruiting and collaboration are the most exposed, while budgets move to consumption-priced AI and cloud.
- Enterprise systems such as
Epic,
SAP and
Salesforce carry far more contacts per account than small-business tools, which changes how campaigns into them should be built.
Every week, someone asks our team a version of the same question: how many companies use this tool? We answer it one technology at a time, for software vendors sizing a competitor's customer base, implementation partners planning a migration practice, research firms building a survey panel and event organizers filling a summit.
This year we decided to answer it for all of them at once.
This is the first edition of what will be an annual report. It is built from our October 2026 data refresh: the same counts that appear on every technology list page on this site. Because it is the first edition, it is a baseline. It shows how the installed base is shaped today. Next year's edition will compare against it, and that is when we will be able to say with confidence which platforms grew, which shrank and where companies switched.
It also lands in an unusual year. The AI boom has come with a wave of layoffs, as companies move budget from people to AI. That is changing installed bases too, though not in the way most people assume: seats and contacts are shrinking faster than the number of companies using each tool.
Even as a snapshot, the shape of the data says a great deal about how B2B campaigns should be planned. Here is what we found.
How to read these numbers
Three notes before the findings, because they change how you read everything below.
These are records, not unique companies. A company that runs 

Counts describe the reachable installed base. No vendor publishes its full customer list. Our counts combine first-party research, public adoption signals and verified contact data. Where a vendor's base can't be fully observed, we use our research team's mid-point estimate. Treat the numbers as the audience you can actually reach, not as a vendor's official customer count.
Contacts per company is only compared where it is measured. For estimated lists, the contact count is projected from the company count at a standard ratio, so it says nothing about how deep that installed base really is. Wherever this report compares depth, it uses lists where the contacts were counted, not projected.
The full method is at the end of this report.
Finding 1: The installed base is a long tail
When people picture "installed base data," they picture the giants: 

Only 5 technologies in our data have more than a million companies. Only 51 have more than 100,000. Meanwhile 636 lists have fewer than 25,000 companies, 410 have fewer than 10,000 and 171 have fewer than 5,000.
Orange bars are lists with fewer than 25,000 companies: 636 of 997. Hover or tap a bar for details.
The median list is
The concentration at the top is real, but it is not the whole story. The 10 largest lists hold 31.2% of all company records and the 100 largest hold 59.9%. That still leaves 40.1% of the installed base spread across almost 900 smaller technologies.
- 31.2%Top 10 lists
- 28.7%Lists 11 to 100
- 40.1%The other 897
What it means: large, pre-built B2B databases are designed around the head of this curve. They have deep coverage of Shopify stores and AWS accounts, and thin coverage of the long tail. But most of the targeting briefs we receive sit in the tail: the users of one competitor's practice management system, the companies running a particular warehouse management system, the hospitals on a specific revenue cycle platform. That is where custom-built lists earn their keep, and where a generic export quietly comes back half empty.
The largest installed bases
Here are the largest technology lists by company count. Switch the chart to contacts to re-rank by the number of verified contacts available, or expand it to the top 25. Each name links to the list.
- 1Zapier Enterprise AutomationProductivity & Collaboration3,400,00915.3M contacts
- 2WooCommerceE-Commerce1,902,1509.2M contacts
- 3ShopifyE-Commerce1,473,3007.6M contacts
- 4QuickBooksFintech & Finance1,272,6016.3M contacts
- 5OpenAI EnterpriseAI Infrastructure1,000,0054.5M contacts
- 6StripeFintech & Finance913,2904.7M contacts
- 7Microsoft TeamsProductivity & Collaboration868,8035.5M contacts
- 8ADPHR & Workforce762,0414.3M contacts
- 9Make.com Integration PlatformProductivity & Collaboration500,0042.3M contacts
- 10Amazon AWSDevOps & Cloud488,6793.3M contacts
- 11Microsoft AzureDevOps & Cloud396,2652.7M contacts
- 12SlackProductivity & Collaboration389,1752.7M contacts
- 13XeroFintech & Finance389,1752.0M contacts
- 14DocuSign Agreement Cloud & eSignatureProductivity & Collaboration357,0502.5M contacts
- 15GitHubDevOps & Cloud325,7862.1M contacts
- 16PaychexHR & Workforce314,9801.8M contacts
- 17Anthropic ClaudeAI Infrastructure300,0021.4M contacts
- 18VMwareDevOps & Cloud292,6162.0M contacts
- 19HubSpot CRMCRM288,7141.3M contacts
- 20Salesforce CRMCRM253,2611.9M contacts
- 21Google Cloud PlatformDevOps & Cloud243,3721.6M contacts
- 22JiraDevOps & Cloud225,3121.6M contacts
- 23Akamai Cloud & CDNDevOps & Cloud197,9471.3M contacts
- 24ConfluenceDevOps & Cloud193,0521.3M contacts
- 25DockerDevOps & Cloud190,2161.3M contacts


Switch between companies and verified contacts to re-rank. Each name links to the list.
Finding 2: Small-business platforms own the top of the chart
Look at who leads: 


 Shopify in our data. If you sell a six-figure platform, almost all of them are the wrong audience.
That is useful to know, and it is also a trap. A big installed base is not the same as a big opportunity. A list of Shopify companies is mostly small merchants. If you sell enterprise commerce infrastructure, the right audience is a small slice of that list, and it has to be filtered out by revenue, order volume, headcount or the other tools in the stack.
The same goes for
What it means: for the largest lists, the work is in filtering. For the long tail, the work is in finding. Both need a list built around your offer, not a generic export.
Finding 3: Enterprise systems are deeper, and need multi-threaded campaigns
The number of companies is only half of an installed base. The other half is how many people at each company matter. Where contacts are counted directly, the variation between technologies is large.
- Epic EMR12.8
- Cerner (Oracle Health)12.5
- Salesforce CRM7.4
- Oracle ERP7.2
- SAP7.1
- Slack6.9
- Amazon AWS6.7
- Microsoft Teams6.4
- Shopify5.2
- QuickBooks5.0
Blue dots mark 7 or more contacts per company. Only lists where contacts are counted directly are shown. A deeper installed base usually means a bigger buying committee per account.
At the top are the systems that run large organizations. 

At the bottom are the tools small businesses run:
That is why a small installed base can be worth more than a big one. Epic has only 14,733 companies in our data, but each one is a large, multi-stakeholder account. A campaign into that base that reaches one person per account is leaving most of the buying committee untouched.
Layoffs are making this harder. As teams shrink, the number of people who matter at each account falls too, which we wrote about here. Depth is the first thing a downsizing changes, well before the company leaves an installed base.
What it means: plan contacts per account, not just account counts. A campaign into a deep installed base should reach several roles at each company, with a message for each. A campaign into a shallow one should focus on finding the single owner fast. This is the core idea behind account-based targeting.
Finding 4: AI already has an installed base bigger than CRM
AI tools have moved from experiment to installed base remarkably quickly. Across our 81 AI infrastructure lists we track 2,487,324 company records. That is more than CRM, a category that has been building its installed base for decades, and more than ERP.
The AI category is also highly concentrated. 


Hover or tap a slice or a name to see its share.
Two things make the AI installed base different from older categories.
Ownership is unclear. CRM belongs to sales operations. ERP belongs to finance and IT. AI is often bought by a product team, a data science lead, an innovation group or an individual department, and the CIO may not be the person who signed. For anyone selling into AI users, finding the actual owner is the first problem to solve.
It sits on top of other installed bases. A company using Azure OpenAI Service is almost always an Azure customer. One using AWS Bedrock runs on AWS. AI adoption is layered on the cloud and data stack underneath it, which makes the combination of the two a sharper signal than either alone. Our tech stack coexistence matrix is built for exactly that kind of overlap.
What it means: if you sell AI security, governance, observability, data infrastructure or implementation services, your audience already exists and it is large. The hard part isn't size. It is finding who owns AI inside each account.
Finding 5: AI-era layoffs are shrinking seats faster than installed bases
2026 is the year the AI boom and the layoff wave became the same story. Through October, US employers announced 171,501 job cuts in technology, 28% of all announced cuts and already more than the sector's total for all of 2025, according to Challenger, Gray & Christmas. Across all industries, employers explicitly cited AI for 121,401 cuts this year, about one in five. Layoffs.fyi counts more than 135,000 tech workers laid off at over 330 companies.
The pattern behind the numbers is a shift in where money goes. As Crunchbase reported, large companies are spending heavily on AI and cutting costs elsewhere to run with smaller teams. Layoffs.fyi founder Roger Lee also told Crunchbase there is little evidence that AI itself is doing the work of the people let go. Oracle is the clearest example: it cut about 13% of its workforce while signing large AI cloud contracts, which we covered here. The money didn't leave. It moved.
For the installed base, that shift plays out in three ways.
1. Seats shrink before logos do. A company that cuts 15% of its staff rarely cancels its CRM, its payroll system or its collaboration suite. It renews with fewer seats. Workday's CEO described the mechanics on the company's November 2025 earnings call: customers "do true ups with us both annually on their headcount," and contracts have "floors and minimums" that limit how far that headcount can fall. Our counts measure companies, so a layoff usually shows up first as fewer people per account, not as a smaller list. That is the same thinning of buying committees we wrote about last week.
2. Some tools lose their reason to exist. A recruiting system in a company with a hiring freeze, or three overlapping sales tools after two teams merge, is the first line in a cost review. And when a company closes, it leaves every installed base at once: Challenger counts 109,342 cuts from closings so far this year.
3. Budget moves to consumption-priced AI and cloud. The AI installed base in Finding 4 is where much of that money went. Unlike seat-priced tools, AI and cloud platforms bill on usage, so a smaller team doesn't automatically mean a smaller bill.
Mapping that onto our data shows which installed bases are most exposed, and how. The counts below come from our lists. The exposure rating is our assessment of how each pricing model responds to headcount cuts.
Salesforce HubSpot
 Apollo.io
 Lusha B2B Sourcing
 ZoomInfo
 Salesloft Sales Engagement
 Outreach
866,849 companies in these lists
Fewer reps means fewer seats at renewal, and merged sales teams consolidate overlapping engagement and data tools.
 Greenhouse
 Lever ATS
 iCIMS
 Workable
 Zendesk
 Intercom
 Freshdesk
 ServiceNow
130,466 companies in these lists
Support is where AI agents most directly take over human work, so agent seats shrink even when the platform stays.
ADP
 Paychex
 Gusto
 Workday
 BambooHR
 Rippling
1,407,581 companies in these lists
Nobody cancels payroll in a layoff, so the company stays in the installed base. What falls is the number of employees it pays for.
 Microsoft TeamsSlack
 Zoom
 DocuSign Agreement Cloud & eSignature
1,657,957 companies in these lists
Licenses are reclaimed from departed staff at renewal. Overlap between suites, such as Teams and Slack or Zoom, gets reviewed.
OpenAI EnterpriseAnthropic ClaudeAmazon AWSMicrosoft Azure
 Google Cloud Platform
 Snowflake
 Databricks
2,511,327 companies in these lists
This is where the money saved on headcount is going. Usage-based billing grows with workloads, not with people.
Company counts are from our lists. The exposure rating is our assessment of how each pricing model responds to headcount cuts, not a measured decline: this baseline edition cannot yet show change over time.
What we can and can't see yet. Because this is our first edition, our counts can't yet show which installed bases contracted. What they do show is where the exposure sits. Seat-priced categories like Marketing & Sales, Productivity & Collaboration and HR & Workforce together account for 14,465,919 company records, around 35.9% of everything we track. The 2028 edition will measure the change in companies and in contacts per company against these counts, and that is where the layoff effect will show.
What it means: in seat-priced categories, every renewal is now a right-sizing event, and a customer that is downsizing is a customer re-evaluating what it pays for. That makes a competitor's installed base unusually open to a cheaper or consolidated offer, which is why renewal-date conquest campaigns work so well right now. It also means contact data goes stale faster in exactly these accounts. Re-verify before every campaign, and aim at the people who now own the bigger, merged budgets.
Finding 6: Some categories are owned by a few platforms, others are wide open
The single most useful number for planning a competitive campaign may be this one: how much of a category its biggest platforms hold. It varies far more than most people expect.
- Largest list
- Top three lists
- E-Commerce69.2%
- Fintech & Finance66.0%
- Productivity & Collaboration59.1%
- AI Infrastructure57.0%
- HR & Workforce47.3%
- CRM29.9%
- Supply Chain29.1%
- ERP21.9%
- DevOps & Cloud21.7%
- Legal & GRC20.2%
- Cybersecurity19.9%
- Data & Analytics16.2%
- Healthcare Tech14.9%
- Marketing & Sales11.2%


Logos are each category’s three largest lists. Top of the chart: a few platforms own the category. Bottom: the installed base is split across many tools.
In E-Commerce, the three largest platforms hold 69.2% of company records. In Fintech they hold 66.0%, led by 
Marketing & Sales is the opposite. It has 121 lists, more than any other category, and its three largest hold just 11.2% of it. Data & Analytics (16.2%), Healthcare Tech (14.9%) and Cybersecurity (19.9%) are similarly fragmented: dozens of credible tools, none of them dominant.
What it means: in a concentrated category, competitor conquesting is a focused play. There are one or two large installed bases and one clear message. In a fragmented category, it is a portfolio. You might target the users of ten smaller competitors with ten slightly different messages, each built around the gaps in that product. Integration partners have the same choice: a few huge ecosystems, or many smaller ones with less competition for attention. Our vendor ecosystem explorer maps them.
For readers who want the exact figures, here is every category:
| Category | Lists | Company records | Largest list | Largest list's share |
|---|---|---|---|---|
| Productivity & Collaboration | 73 | 8,071,589 |  Zapier Enterprise Automation | 42.1% |
| DevOps & Cloud | 110 | 5,579,388 | Amazon AWS | 8.8% |
| E-Commerce | 55 | 5,119,179 | WooCommerce | 37.2% |
| Fintech & Finance | 81 | 3,901,798 | QuickBooks | 32.6% |
| Marketing & Sales | 121 | 3,733,149 |  ActiveCampaign | 4.4% |
| HR & Workforce | 64 | 2,661,181 | ADP | 28.6% |
| AI Infrastructure | 81 | 2,487,324 | OpenAI Enterprise | 40.2% |
| CRM | 58 | 2,290,691 | HubSpot CRM | 12.6% |
| ERP | 64 | 1,758,821 |  Microsoft Dynamics 365 Business Central | 9.2% |
| Cybersecurity | 88 | 1,478,514 |  Sophos Cybersecurity & MDR | 9.7% |
| Data & Analytics | 81 | 1,363,466 |  Confluent Apache Kafka | 7.1% |
| Healthcare Tech | 58 | 904,066 |  DrFirst Healthcare Medication Management | 5.2% |
| Legal & GRC | 37 | 548,842 |  Clio Legal Practice Management | 7.9% |
| Supply Chain | 26 | 451,901 |  Motive (KeepTruckin) | 11.1% |
Finding 7: ERP is led by the mid-market
The ERP picture surprises people. The largest ERP list in our data is not SAP or Oracle. It is Microsoft's mid-market platform.
- 1Microsoft Dynamics 365 Business Central162,2481.1M contacts
- 2SAP126,379902K contacts
- 3Oracle ERP96,622693K contacts
- 4NetSuite ERP86,880594K contacts
- 5Odoo73,012457K contacts
- 6Infor ERP48,771326K contacts


SAP and Oracle customers are fewer but larger, with 7.1 and 7.2 contacts per company respectively. For implementation partners, 2027 is defined by the end of mainstream maintenance for SAP ECC, which we covered in detail here. The ECC base is among the most valuable migration audiences of the year, and it gets harder to reach the closer the deadline gets, because every partner is calling the same accounts.
What it means: ERP vendors and partners chasing the mid-market have the largest pool to work with, and the most competition from Microsoft's channel. Partners focused on SAP and Oracle have fewer, larger and more time-sensitive opportunities.
Finding 8: Cloud is a three-way market with a legacy layer
- 1Amazon AWS488,6793.3M contacts
- 2Microsoft Azure396,2652.7M contacts
- 3VMware292,6162.0M contacts
- 4Google Cloud Platform243,3721.6M contacts
Alongside them sits 
DevOps & Cloud is also one of the least concentrated large categories. Its largest list holds only 8.8% of the category across 110 lists, because modern engineering stacks are made of many tools: 


Finding 9: CRM is a two-horse race with a busy chasing pack
- 1HubSpot CRM288,7141.3M contacts
- 2Salesforce CRM253,2611.9M contacts
- 3Zoho CRM143,664915K contacts
- 4HighLevel (GoHighLevel) CRM128,271874K contacts
- 5Pipedrive CRM97,679598K contacts


CRM is also where installed base data and current events meet most often. 
Finding 10: Vertical software is small, specialized and underserved
Some of the most valuable installed bases in our data are also the smallest. Healthcare Tech (58 lists), Legal & GRC (37) and Supply Chain (26) are the three smallest categories by company records, but each is full of tools that run mission-critical operations.
In healthcare, no single platform dominates. The largest list, 


What it means: vertical installed bases are exactly where generic databases are thinnest and where buyers are most specific about what they need. They reward precise targeting, industry-literate messaging and patience. They are also where most of our custom research requests come from.
The whole market in one view
Putting it together, here is every category by company records. AI Infrastructure is highlighted.
- 1Productivity & Collaborationled by Zapier Enterprise Automation8.1M20.0% of all
- 2DevOps & Cloudled by Amazon AWS5.6M13.8% of all
- 3E-Commerceled by WooCommerce5.1M12.7% of all
- 4Fintech & Financeled by QuickBooks3.9M9.7% of all
- 5Marketing & Salesled by ActiveCampaign3.7M9.3% of all
- 6HR & Workforceled by ADP2.7M6.6% of all
- 7AI Infrastructureled by OpenAI Enterprise2.5M6.2% of all
- 8CRMled by HubSpot CRM2.3M5.7% of all
- 9ERPled by Microsoft Dynamics 365 Business Central1.8M4.4% of all
- 10Cybersecurityled by Sophos Cybersecurity & MDR1.5M3.7% of all
- 11Data & Analyticsled by Confluent Apache Kafka1.4M3.4% of all
- 12Healthcare Techled by DrFirst Healthcare Medication Management904K2.2% of all
- 13Legal & GRCled by Clio Legal Practice Management549K1.4% of all
- 14Supply Chainled by Motive (KeepTruckin)452K1.1% of all
AI Infrastructure is highlighted. The logo is each category’s largest list. Each category links to its hub.
Productivity & Collaboration, DevOps & Cloud and E-Commerce are the largest categories by records, driven by tools that nearly every business uses. The categories that matter most to a given campaign, though, are rarely the biggest. They are the ones where your buyers live.
Size Your Own Installed Base
Tell us which technologies, regions and company sizes matter to you. We'll show you how many companies match before you commit to anything.
Build Your Audience →Installed bases to watch in 2027
An installed base is static until something changes. These are the changes we expect to turn quiet installed bases into active buying audiences next year:
- .NET 8 and .NET 9. Both lost support on November 10, 2026. The applications still run, which is exactly why many teams will wait, and why outreach matters. Read our analysis.
- Seat-priced tools in downsizing companies. With AI cited in about one in five US job cuts this year, renewals of per-seat sales, support, recruiting and collaboration tools will keep shrinking. Each one is a moment when the customer reconsiders the vendor.
- AI platforms. As AI moves from pilot to production, governance, security and cost-control tools will follow the installed base, and companies will start consolidating vendors.
In each case the advantage goes to whoever knows which accounts are affected before the deadline, not after. We wrote about this pattern in our post on renewal-date campaigns.
What this means for your team
The same data reads differently depending on what you sell. Here is how each of the teams we work with should use it.
Software vendors
Start with the fragmentation chart. If your category is concentrated, build one sharp campaign against the leader's installed base. If it is fragmented, build a portfolio of smaller campaigns against several competitors, each with its own message. Either way, size the audience after filtering for your ICP, not before. See our competitor conquesting playbook.
Implementation partners and consultancies
Your best audiences are defined by change: end-of-support dates, acquisitions and platform migrations. The ERP and cloud findings above are your map for 2027. Depth matters too. SAP and Oracle accounts need a campaign that reaches IT, finance and the business owner together. See our legacy modernization use case.
ISVs and integration partners
Your market is someone else's installed base. A large, concentrated ecosystem offers scale. A smaller, fragmented one offers less competition. Companies that use two tools you integrate with are often the best prospects of all. See our integration ecosystem use case.
Market research firms
The long tail is your opportunity. Panels built from verified users of a specific technology produce better answers than self-reported ones, and small installed bases are exactly where self-reported panels fail. See our market research surveys use case.
Event organizers
Platform summits fill fastest when the invitation list is built from the platform's actual users, at the right seniority, across the full buying committee. The depth findings tell you how many invitations each account can support. See our event marketing use case.
Key takeaways
Epic (12.8 contacts per company) need multi-threaded outreach. Small-business tools need a fast route to one owner.What we'll track for the 2028 edition
Because this is a baseline, the most interesting findings are still ahead. Next year we will report:
- Growth and decline by technology: which installed bases expanded and which contracted, measured against the counts in this report.
- Switching between platforms: which competitor pairs saw the most movement, for example from VMware to the public cloud, or from SAP ECC to S/4HANA and its rivals.
- The layoff effect: whether seat-priced installed bases lose companies, or only seats and contacts, measured against this baseline.
- AI ownership: whether AI tools move from single teams to company-wide systems, and who ends up owning them.
- New categories: which technologies grew large enough to earn their own list over the year.
If there is a technology or category you want us to cover, tell us. We will add it.
Methodology
This report uses the 997 technology lists published on this site as of our October 2026 data refresh. For each list we record the number of companies using the technology and the number of verified business contacts at those companies. Totals are sums across lists, so a company using several technologies is counted once per list. Lists that were merged into another list are counted once.
Company counts come from first-party research and public adoption signals, such as website technology, job posts that ask for the tool, and integration and partner directories, and are refreshed on a regular cycle. Where a vendor's installed base can't be fully observed, we use our research team's mid-point estimate, and the contact count for that list is projected at a standard ratio. Comparisons of contacts per company in this report use only lists where contacts were counted directly. Contacts are SMTP-verified, with bounces and spam traps removed, and every list is compliant with GDPR, CAN-SPAM and CCPA. Our methodology page has the full detail.
Every figure in this report matches the count on the corresponding list page. You are welcome to cite it. Please credit "Data InfoMetrix, State of the Installed Base 2027" and link to this page.
How we build installed base data
We build custom technology user lists for software companies, implementation partners, research firms and event organizers. Every list is built fresh for the brief, not exported from a static database, and every contact is verified before delivery. We guarantee 99% email deliverability and replace every hard bounce one for one.
With 238M+ contact records across 997 technology lists, we can tell you how big your audience is before you spend a dollar on reaching it. The installed base has a shape. Knowing it is the first step in any campaign worth running.
Frequently asked questions
What is the State of the Installed Base report?
It is an annual Data InfoMetrix report on how B2B software adoption is distributed, built from every technology list we maintain. The 2027 edition is the first, based on our October 2026 data refresh, and sets the baseline that future editions will compare against.
What is an installed base?
An installed base is the set of companies that currently use a specific technology, such as Salesforce, SAP or AWS. Installed base data lets vendors, partners and researchers target the users of a particular product.
Are the totals in the report unique companies?
No. Totals are records summed across technology lists, so a company that uses several technologies is counted once per list. Each record is a separate targeting opportunity.
Which technologies have the largest installed bases?
In our data the largest installed bases are small-business-friendly platforms such as WooCommerce, Shopify, QuickBooks and Stripe, along with AI and collaboration tools. Most technologies are much smaller: the median list covers under 15,000 companies.
How are AI-driven layoffs affecting technology installed bases?
Mostly by shrinking seats and contacts per account rather than the number of companies using a tool. Companies that cut staff usually keep their CRM, payroll and collaboration software but renew with fewer seats. Seat-priced categories such as sales, customer support, recruiting and collaboration are the most exposed, while budgets are moving to consumption-priced AI and cloud platforms. Challenger, Gray & Christmas counted 121,401 US job cuts citing AI through October 2026.
Does the report show which platforms grew or shrank?
Not yet. Because this is the first edition, it is a snapshot. The 2028 edition will compare against these counts to show growth, decline and switching between platforms.
Can I cite the State of the Installed Base report?
Yes. Please credit "Data InfoMetrix, State of the Installed Base 2027" and link to the report page. Every figure matches the count on the corresponding technology list page.
 Written byJohn BrittonVP of Marketing at Data InfoMetrix / MedicalProspects
Related articles

Why Technology Adoption Is the Buying Signal Most Revenue Teams Still Ignore
Most B2B teams still build target lists by asking if an account fits their ICP. Learn why technology adoption—what a company already runs—is the ultimate buying signal that predicts why and when accounts convert.
 Olivia Thomas · 11 min read
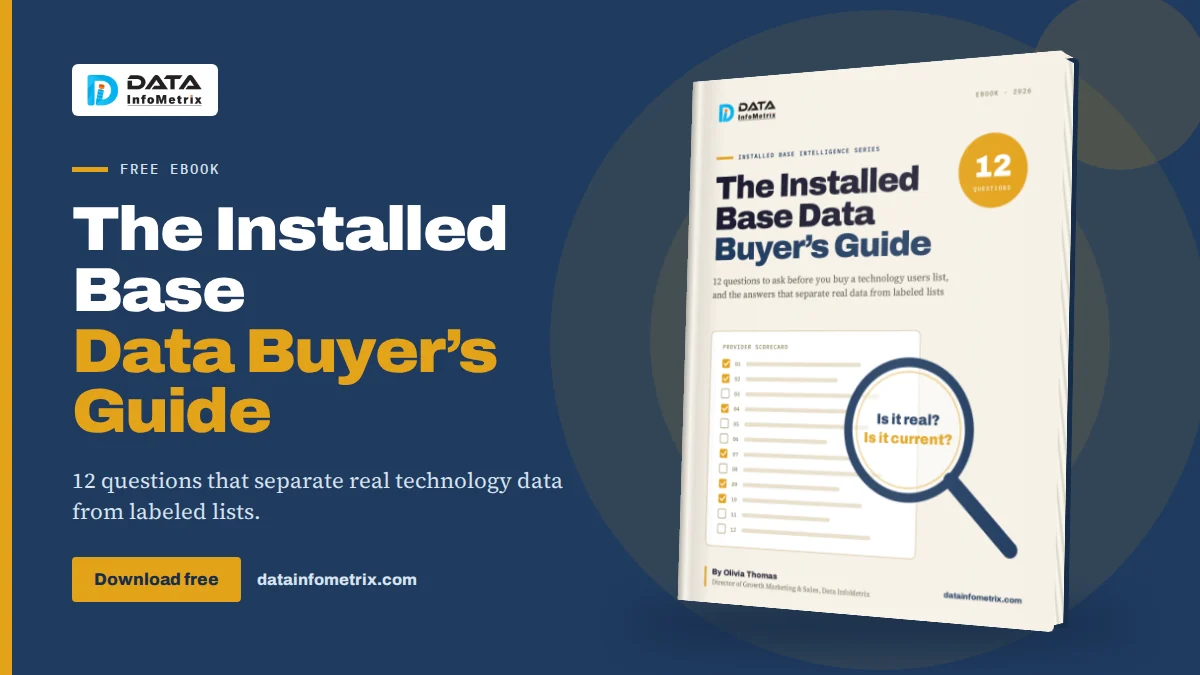
Best Installed Base Data Providers in 2027, by Use Case
Installed base data tells you which companies run which technology. Seven providers compared by the job they do best, with how each one collects its data and what to ask before you buy.
Olivia Thomas · 10 min read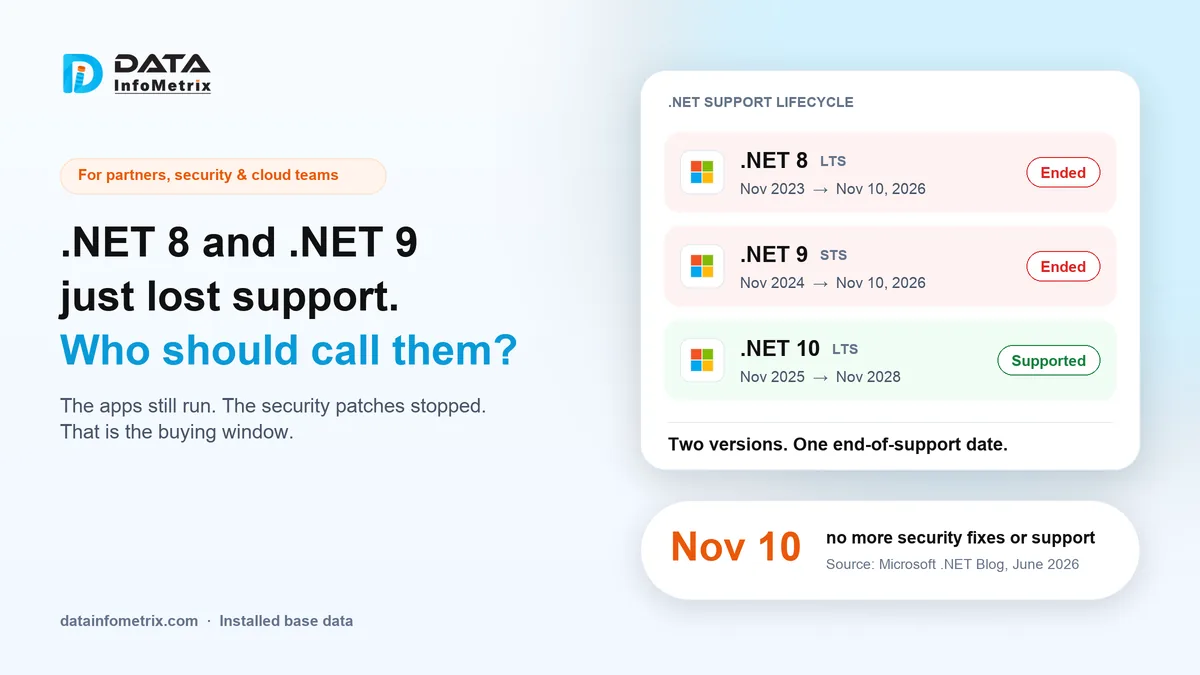
.NET 8 and .NET 9 Just Lost Support. Here Is Who Should Be Calling Those Companies.
On November 10, 2026, Microsoft stopped patching .NET 8 and .NET 9. The apps still run, which is exactly why so many companies will leave them alone. Olivia Thomas on who should be reaching those companies, and how to find them.
Olivia Thomas · 9 min read